The GIS and Visualization group operates the Technology Sandbox, and more examples of our work can be found on the Sandbox website.

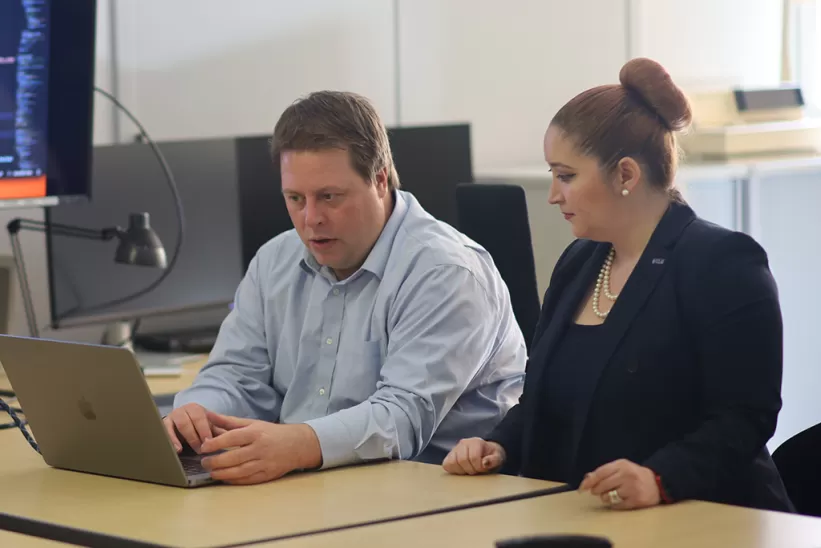
OARC’s GIS and Visualization group can help bring your research to life. We are experts in the broad range of analytic tools and techniques for visualizing data, including GIS and mapping, 3D modeling, and extended reality (XR). Our goal is to help you organize your data into a coherent visual display that can be readily interpreted and understood, whether that be through spatial, graphical, or interactive presentations. Our experts can also advise you on generating data for 3D models or XR applications, such as through 3D scanning and LIDAR.
Our team is uniquely positioned within OARC to support digital humanities and computational social science. We value working with interdisciplinary teams as we explore the opportunities for discovery and innovation afforded by large-scale datasets and new forms of born-digital scholarship.
Request a Consultation
Services
- We are available to meet with you and offer guidance on your research projects for free, up to 10 hours per quarter.
- Get answers to your data visualization questions.
- We will get back to you with an answer as soon as we are able or refer to one of our campus partners.
- We are available to collaborate with your project team on a cost-recovery basis
- Buy-out time from members of our team for medium- or long-term engagements


