Create graphs and charts to accompany scientific publications.
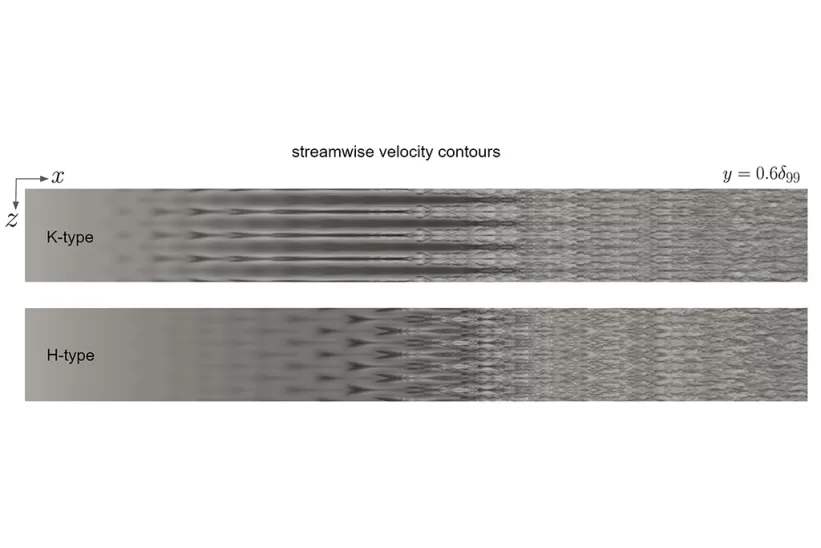
Data visualization is the subset of visualization that involves the graphic display of data.
Often data analysis can be summarized and communicated visually through detailed graph and chart constructions. In some cases, datasets may be too complex for manual processing and visualizations are created using an algorithmic process or generated from a large-scale dataset. Prime examples of this type of visualization include 100K DLA simulation, laser simulation, fluid simulation, and network analysis.
Solutions We Offer
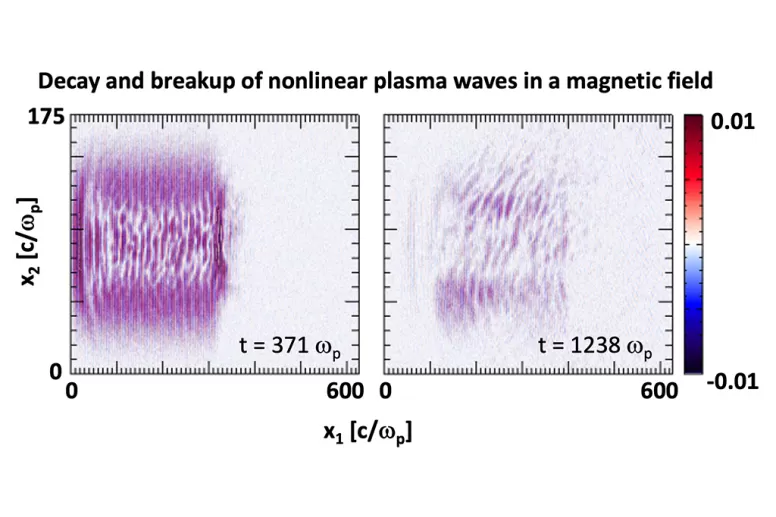
Scientific Visualization
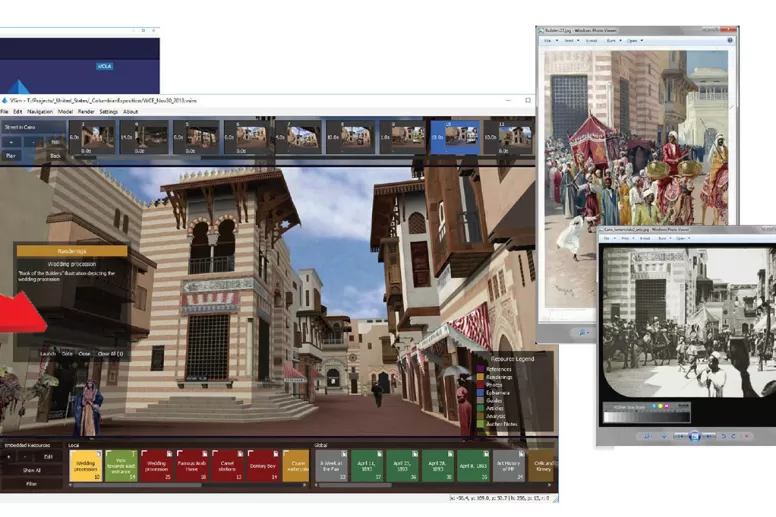
3D Modeling
Develop three-dimensional models and recreations of objects or locations through the generation of geometry either manually, from data, or from a scanning process.
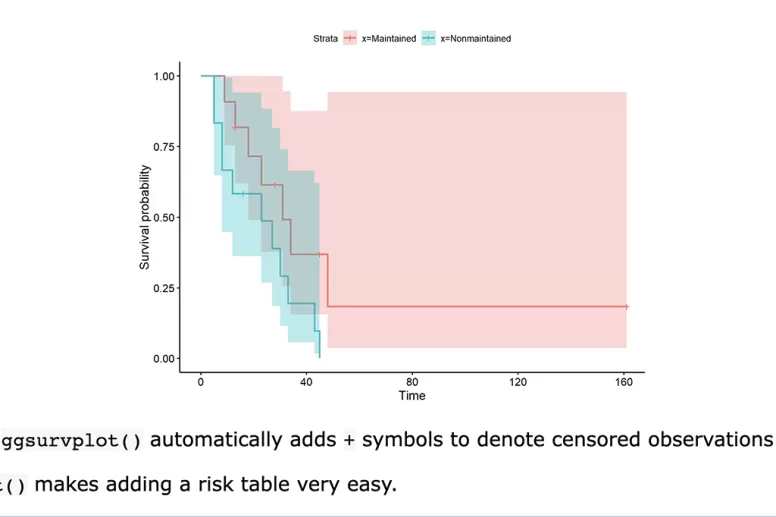
Visualizations for Statistical Graphs
Create graphs and charts based on statistical analyses.
